How to build a robust forecasting model in Excel - A checklist
When building forecasting models in Excel robustness is more important than accuracy. The goal is to create a model that helps you make informed decisions and understand the risks when you make those decisions. Here is how:
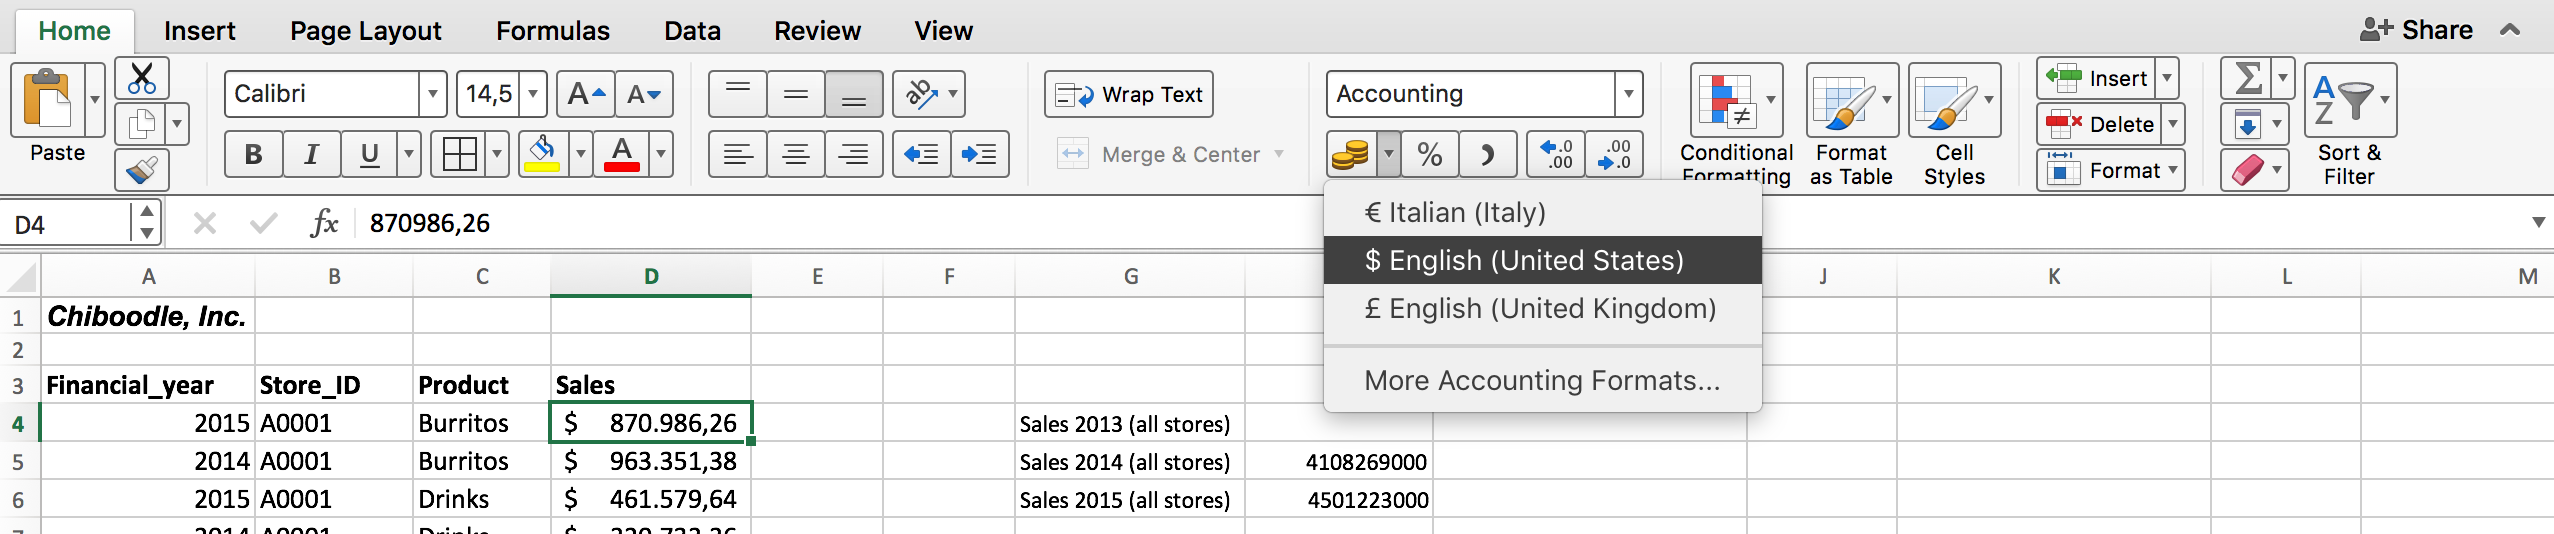
- [REVIEW THE SOURCE DATA] Make sure the source data is formatted in the right way: (1) Quantities should be formatted as “Number”, revenue data should be formatted as “Currency” etc; (2) White rows should be deleted; (3) “Total” rows should be deleted if they interfere with calculations.

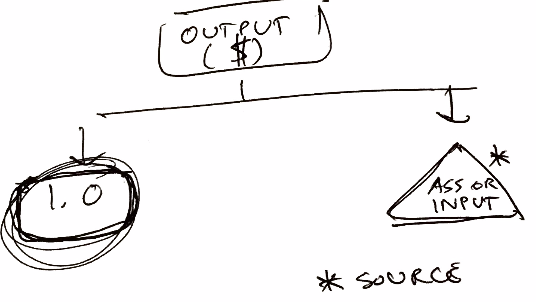
- [START WITH THE OUTPUT IN MIND] Think about what output you want to get at the end. For examples, the sales forecast for next year or the number of employees forecasted for the next few years.
- [DRAW A RELATIONSHIP TREE] Work backwards and create on paper a relationship tree that shows what calculations you need to make to get to that output.
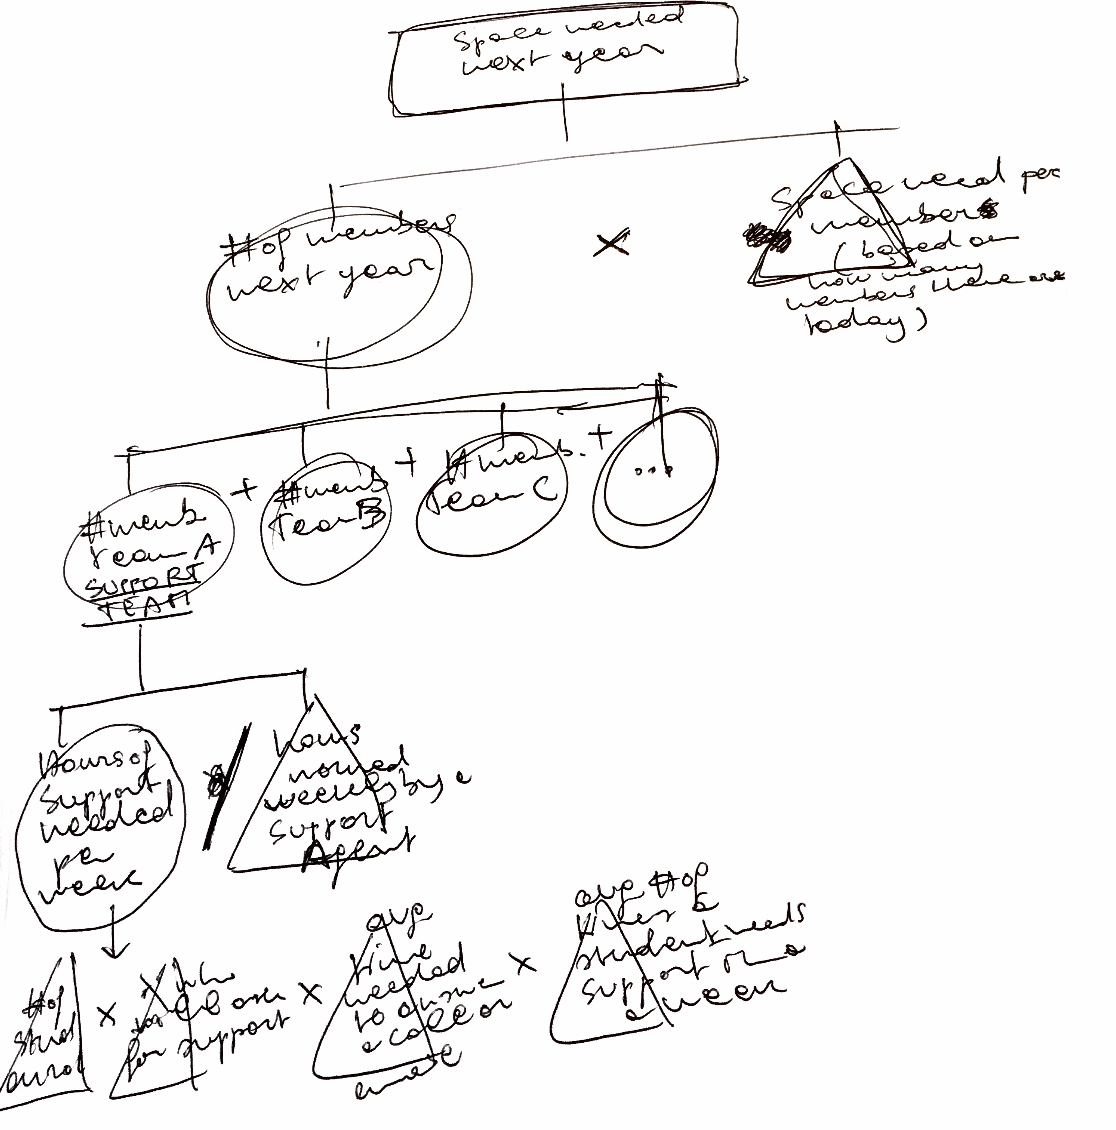

Highlight what elements of those calculations are inputs, assumptions or intermediate calculations and what’s the final output. Stop with assumptions when you can’t make anymore a reasonable assumption that is based on a reliable source.

[START WITH HYPOTHESIS] When you create this relationship tree you may already have an hypothesis about what variable is affecting the output the most and you create the relationship tree in a way that that variable is included in your calculations. It is good practice to have an hypothesis about the story that you want to tell with the data, even before doing the actual analysis. For example, if you think that the number of hours spent providing support to your users are one of the key reasons why margins are low, you should include that in your model. So, you can experiment how the profit forecast changes when the hours spent doing support decrease.
[BE READY TO CHANGE THEM] However, be intellectually honest. Your hypothesis is an hypothesis and may be wrong. The model can show you that there are other variables that are driving costs up. In that case, you have to do more work and modify the model so it shows the impact of those other variables.
- [CREATE WIREFRAMES ON PAPER] Wireframe on paper the tables that you want to create on Excel and even the slides that you want to show for your presentation.
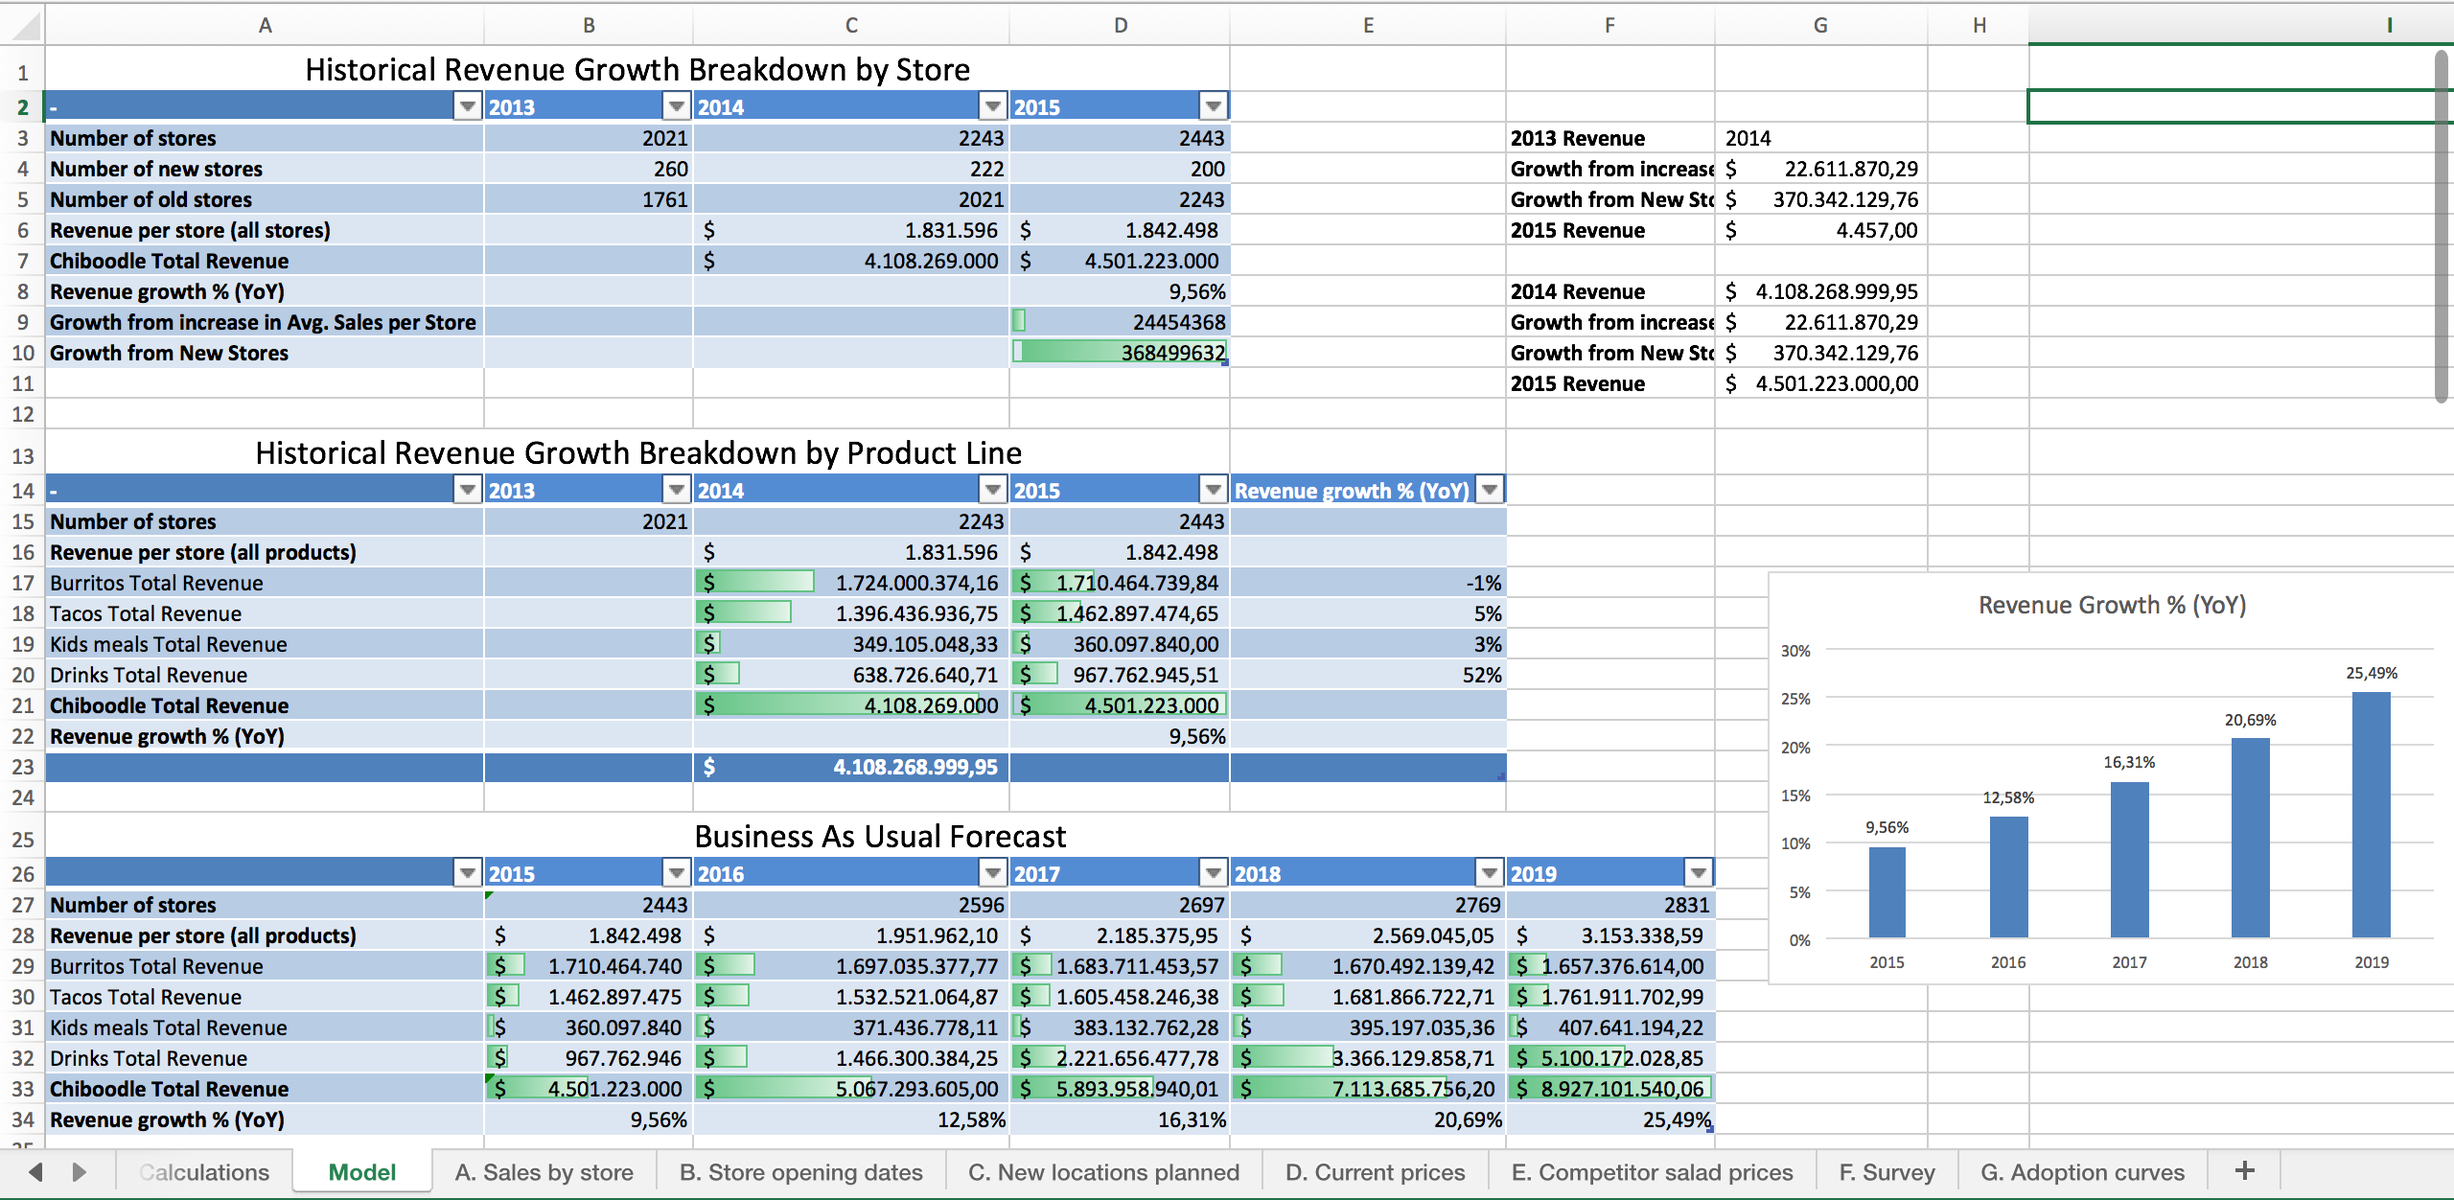
- [CREATE TWO SHEETS ON EXCEL] Start creating the model on Excel by creating two sheets: (1) One called “Model” where you add your tables with your calculations
-

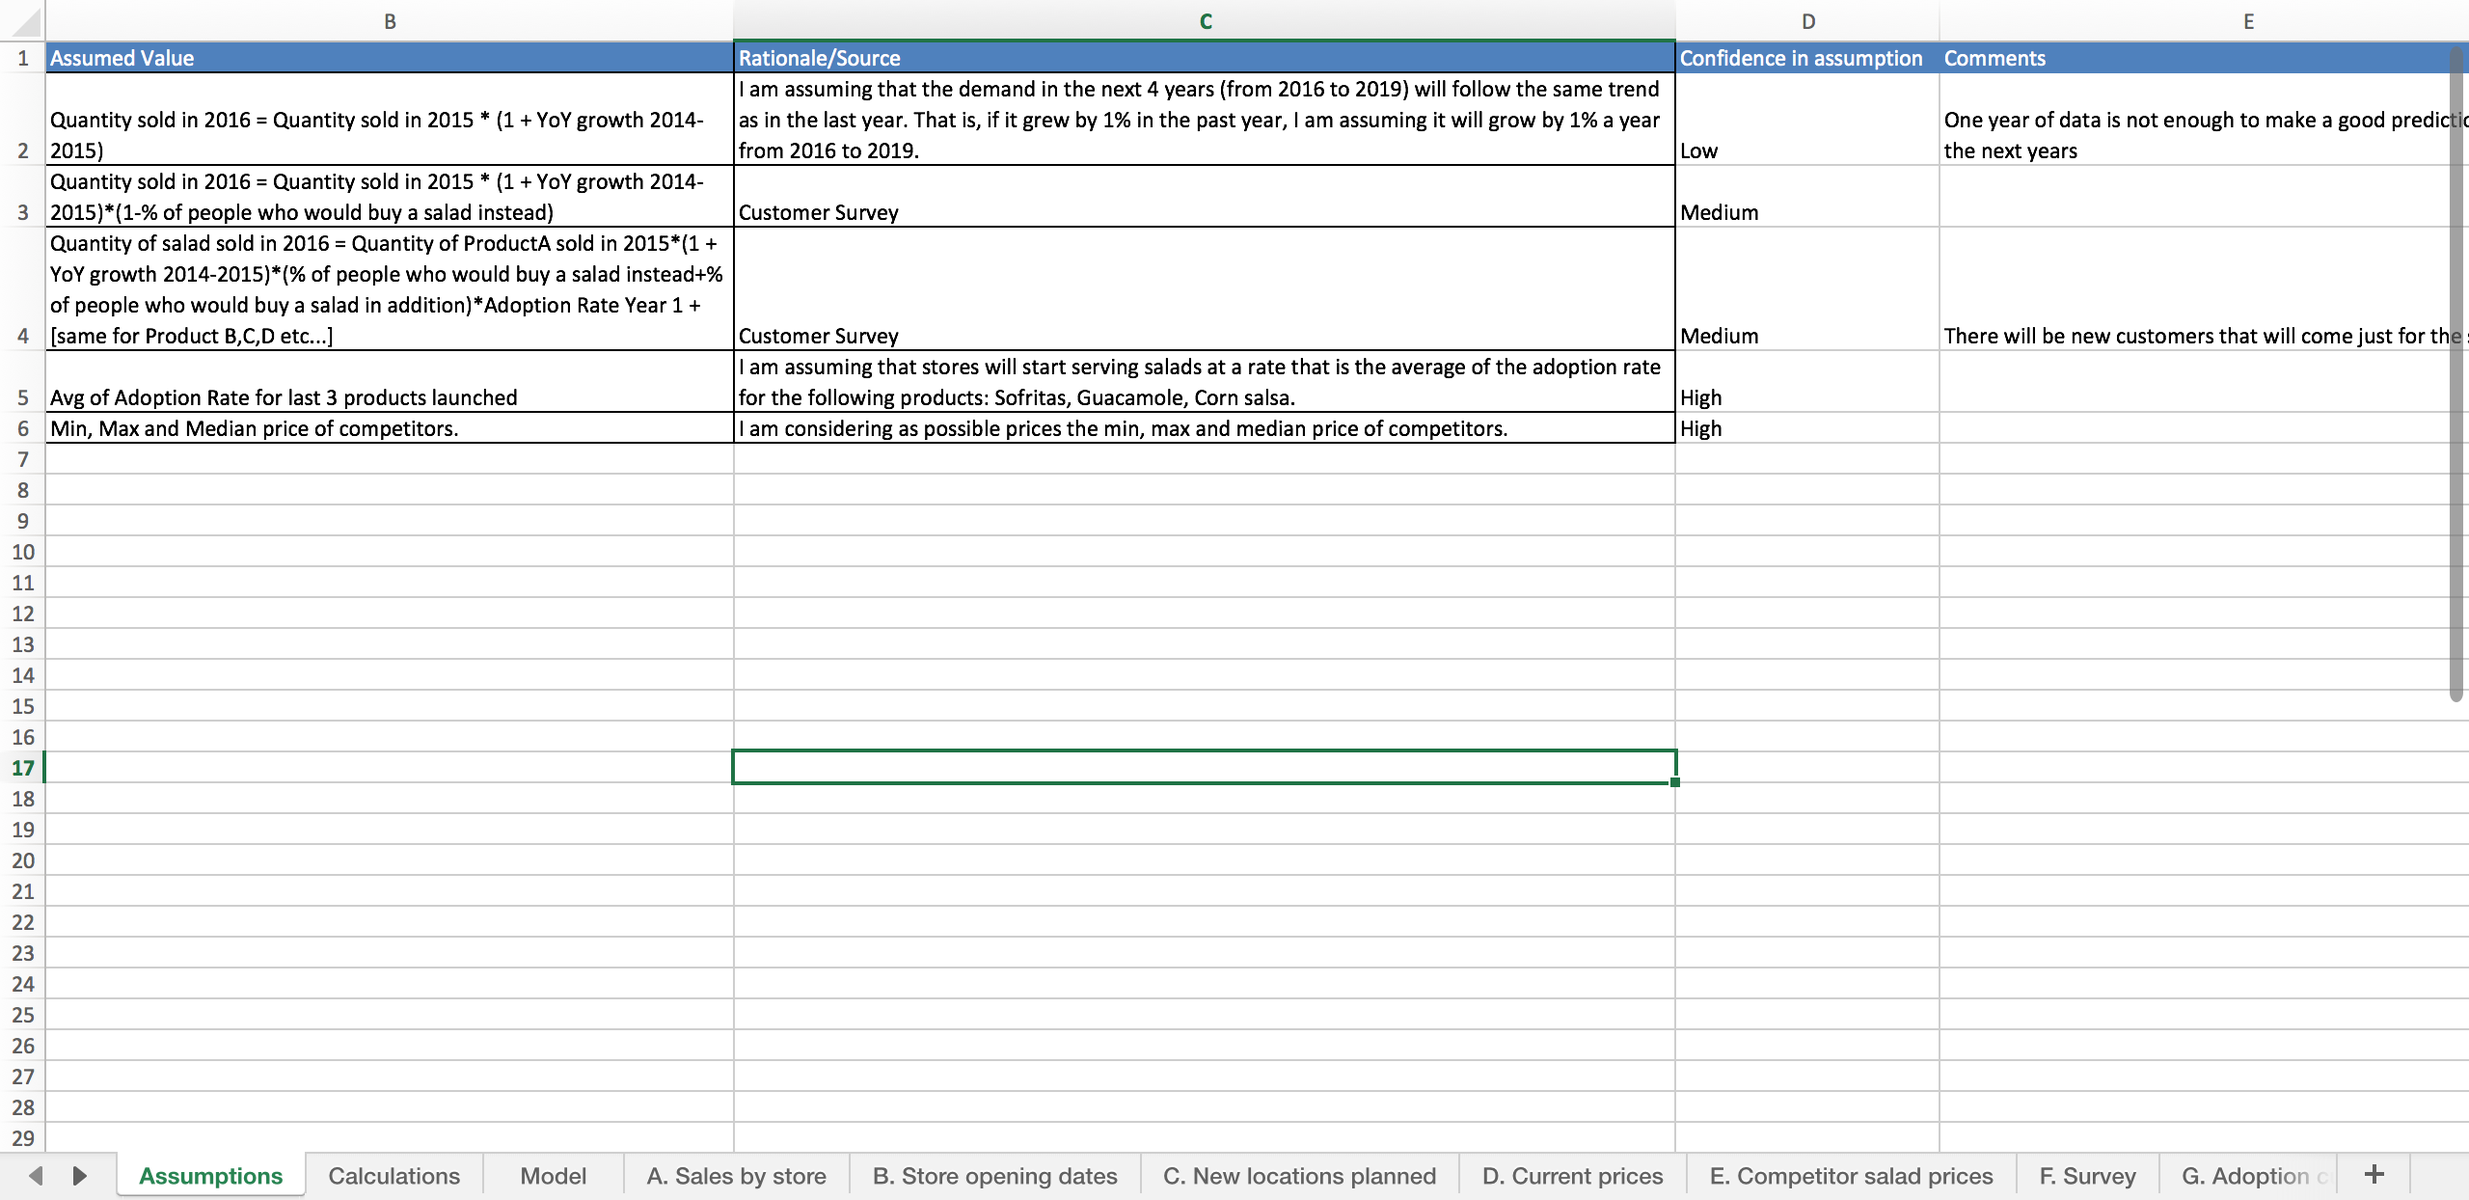
- (2) One other super important called “Assumptions”. In this sheet you will write down what are your assumptions, what is the rationale and how confident you are.

- [START WITH HISTORICAL DATA] When filling out the “Model” sheet, always start with the historical data. You will use it as a benchmark, to check whether the numbers you come up with with your calculations make sense.
- [DOUBLE CHECK ALL CALCULATIONS] Common sense also helps. It’s not realistic for example that a retail stores grows its sales at a rate that is 10x the GDP. Look out for these red flags and double check your calculations.
- [MAKE IT EASY TO SEE WHAT HAPPENS WHEN YOU CHANGE ASSUMPTIONS] Create the model so that is as easy as possible to change your assumptions and see how those modifications affect the output
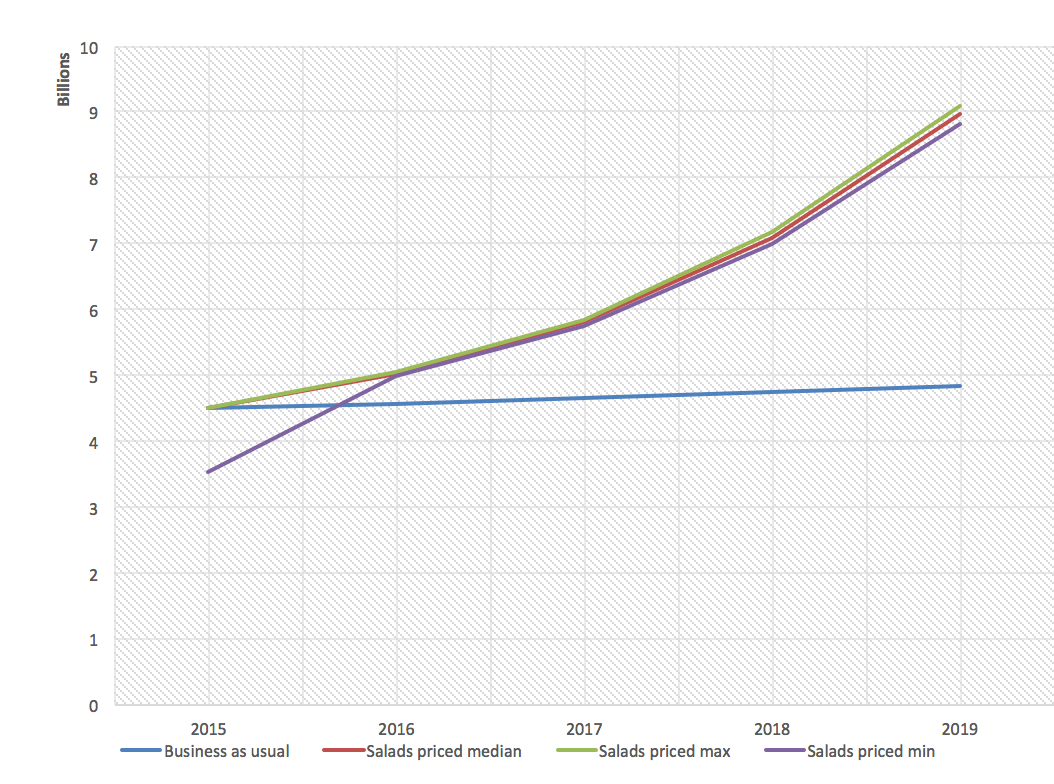
- [SENSITIVITY ANALYSIS] Build different scenarios to understand what happens if your assumptions are incorrect and how sensitive is your model to each assumption. Make sure you are aware of which assumptions your model is most sensitive to.

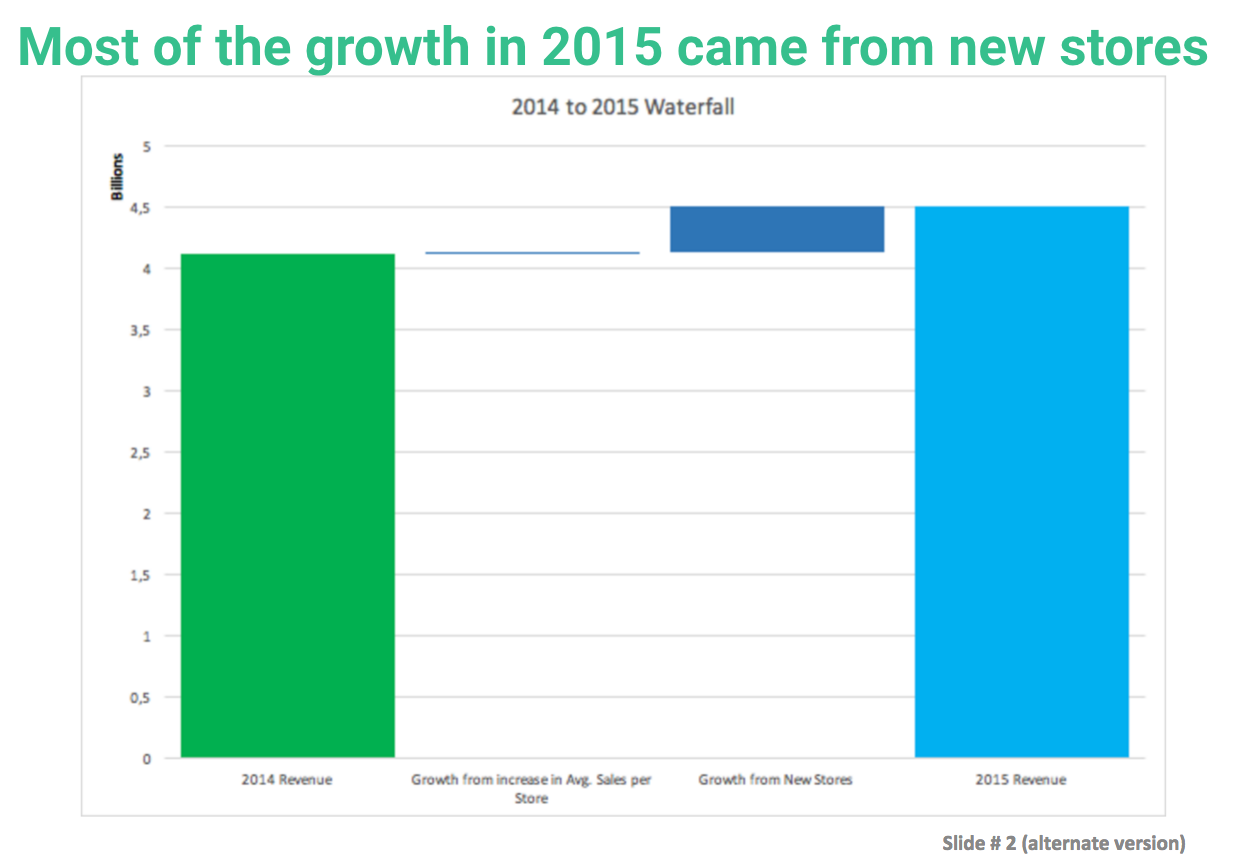
- [CHARTS] Are the charts you’ve chosen the best way to tell the audience the story you want to tell?

- [MAKE DATA EASY TO READ] Round up numbers when you’re including tables in a slide deck so they’re easier to read
